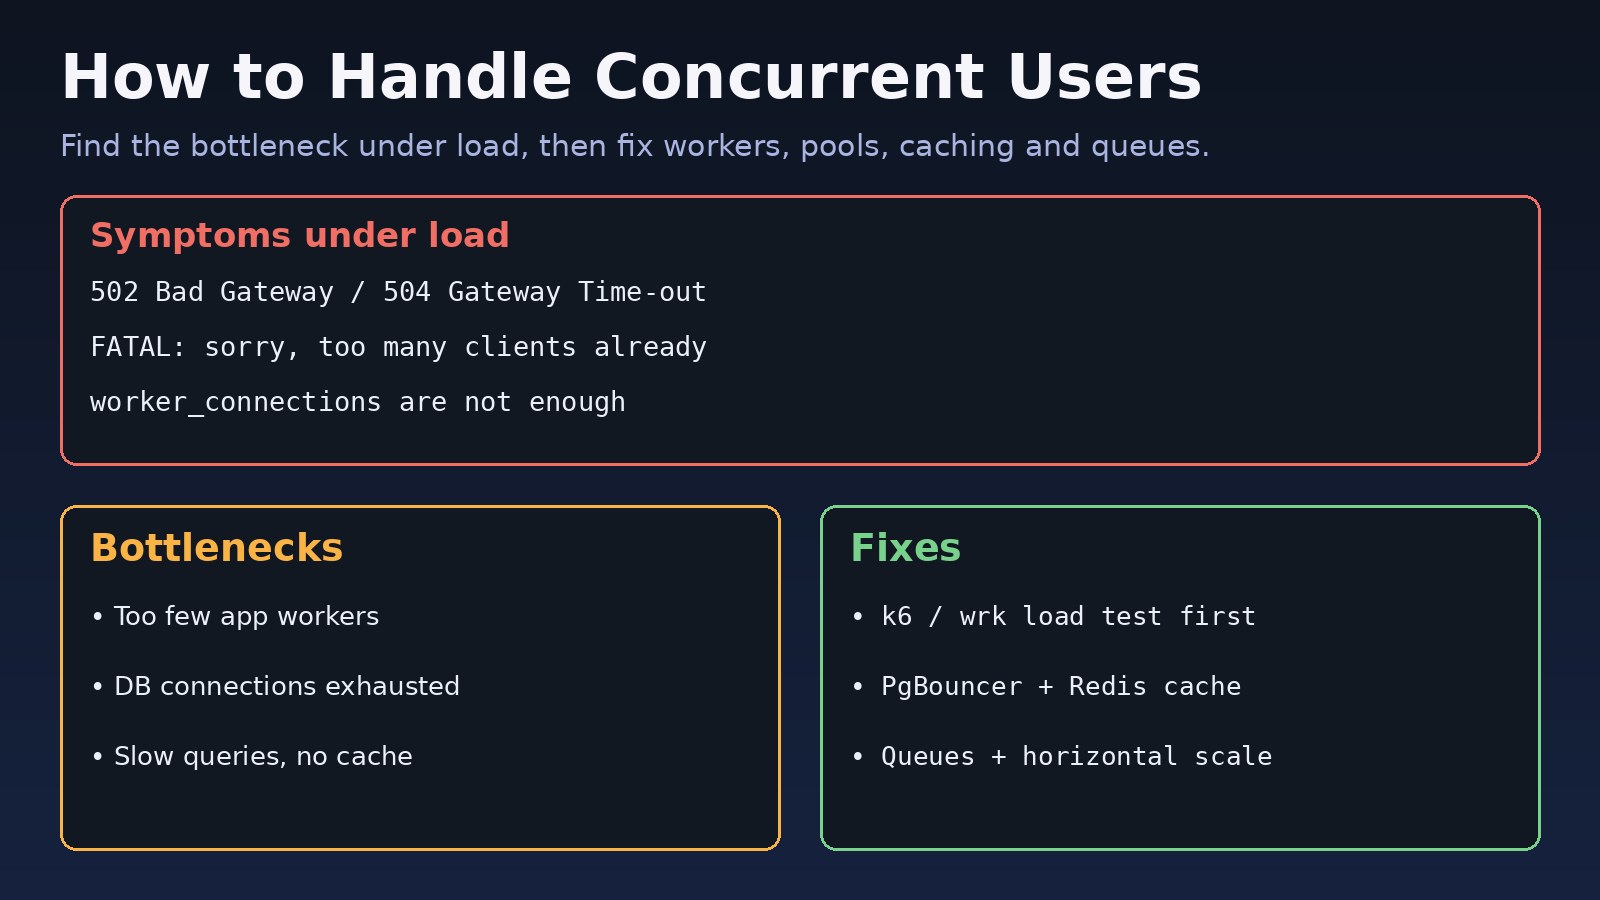
Your app works fine with fifty users, then a campaign goes live and pages hang, APIs return 502, and the database refuses new connections. Learning how to handle concurrent users is less about buying a bigger server and more about finding which layer runs out first: web server connections, application workers, database connections, or slow queries. This guide walks through diagnosing a high concurrency web application under load and fixing each bottleneck with real configuration for Nginx, Node.js/Next.js, Laravel/PHP-FPM, PostgreSQL and Redis.
The Problem: Your App Cannot Handle Concurrent Users
Concurrency is the number of requests being processed at the same moment. Every request holds resources while it runs: a TCP connection in Nginx, a worker or event-loop slot in your app, and often a database connection. If one request takes 2 seconds and you have 20 PHP-FPM workers, you can serve about 10 requests per second; request number 21 waits in a queue. When the queue fills, users see timeouts. Target numbers like 100,000 concurrent users are only reachable when each request is short and each layer can scale out.
Symptoms of a Concurrency Bottleneck
You will usually see one or more of these in logs during traffic spikes:
# Nginx error.log
upstream timed out (110: Connection timed out) while reading response header from upstream
connect() to unix:/run/php/php8.3-fpm.sock failed (11: Resource temporarily unavailable)
1024 worker_connections are not enough

# PHP-FPM log
WARNING: [pool www] server reached pm.max_children setting (20), consider raising it

# PostgreSQL / application
FATAL: sorry, too many clients already
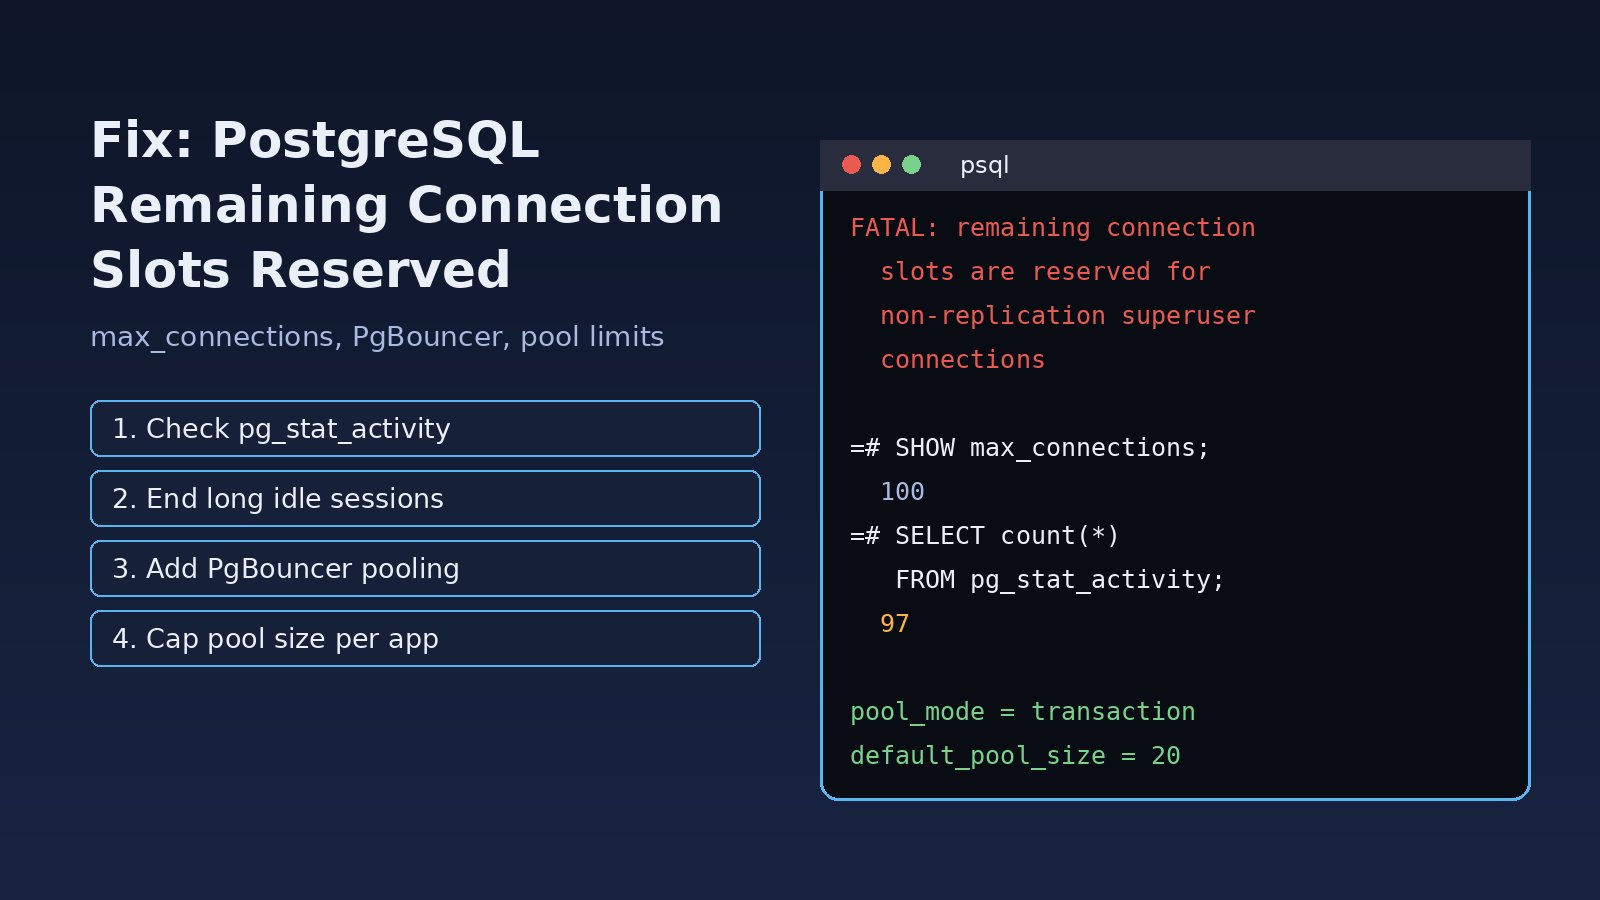
FATAL: remaining connection slots are reserved for non-replication superuser connections

# Node.js
Error: connect EMFILE / Error: Too many open files
TimeoutError: ResourceRequest timed out (pool acquire timeout)- Response time grows sharply as users increase, while CPU on the app server is not maxed out (a sign of waiting on locks or connections).
- Users get 502 Bad Gateway or 504 Gateway Time-out from Nginx.
- Database CPU or active connections spike, and the same few queries dominate.
- Memory climbs until the OOM killer restarts workers.
Root Cause: Why Web Applications Fail Under High Concurrency
Too few workers or blocked event loops
PHP-FPM, Gunicorn and similar servers handle one request per worker. A Node.js process handles many requests, but only one CPU-bound task at a time; a synchronous JSON parse or bcrypt call blocks everyone.
Database connection exhaustion
Each app instance opens its own pool. Ten instances with a pool of 20 means 200 connections, and PostgreSQL defaults to max_connections = 100. Our guide on PostgreSQL connection pool exhausted covers this error in depth.
Slow queries and no caching
A missing index that costs 300 ms is invisible with five users and fatal with five thousand, because every request holds a connection that long.
Work done inside the request
Sending emails, generating PDFs or calling third-party APIs synchronously keeps workers busy for seconds.
Stateful servers
Sessions stored on local disk or in memory prevent you from adding more instances behind a load balancer.
Step-by-Step Solution to Handle Concurrent Users
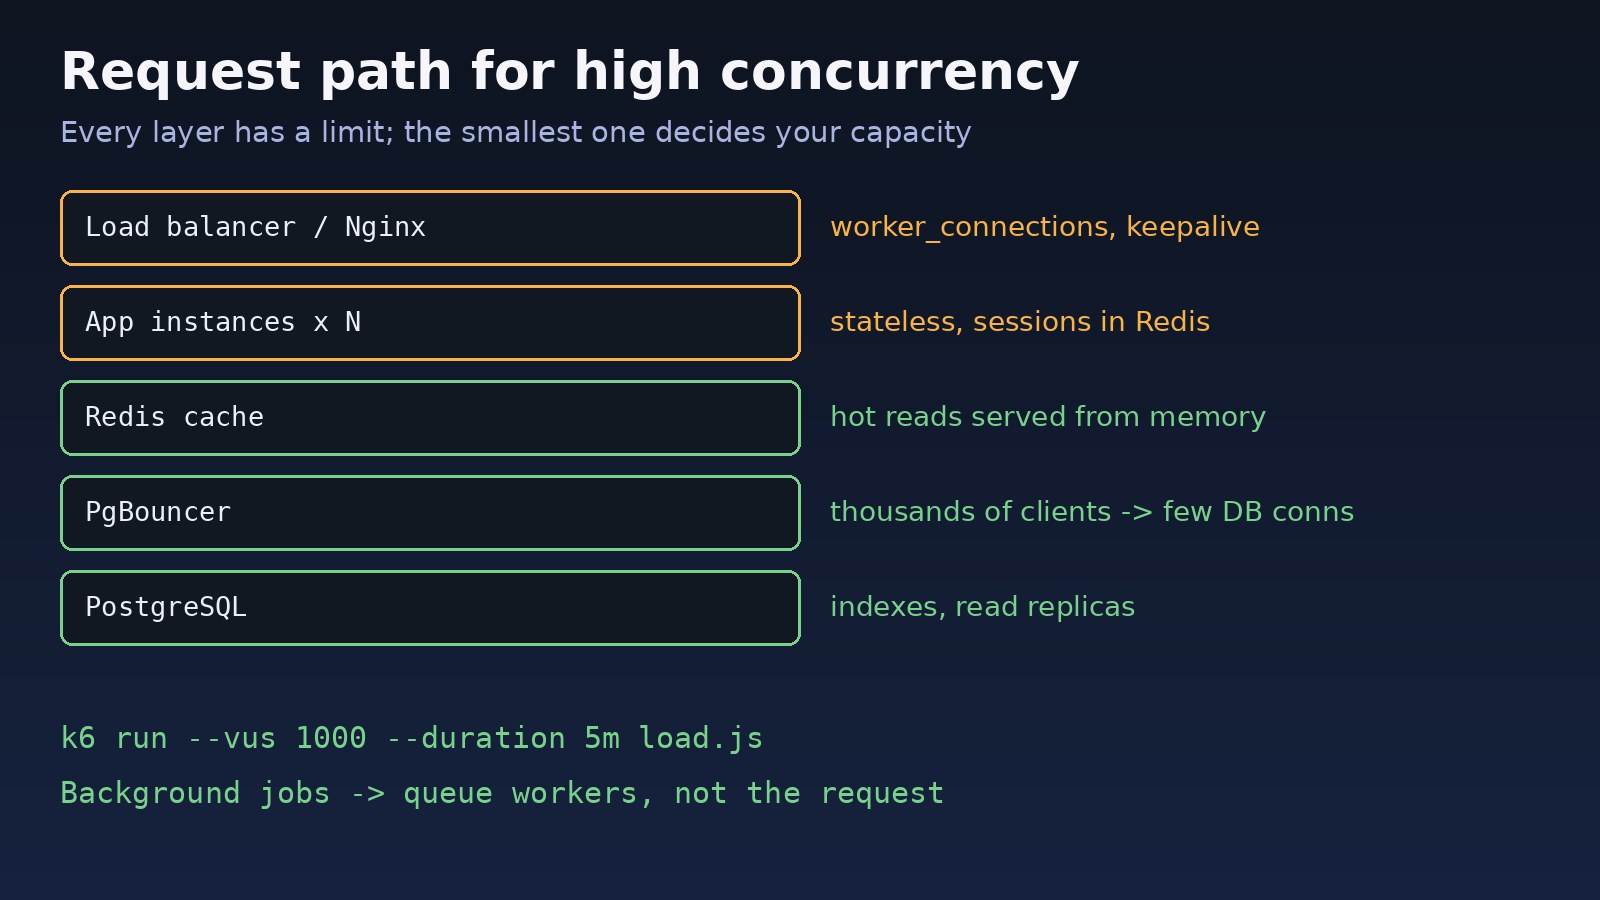
Step 1: Load test to find the real bottleneck
Never tune blindly. Reproduce the load on a staging copy with k6 or wrk and watch every layer at the same time.
// load.js  (k6)
import http from 'k6/http';
import { check, sleep } from 'k6';
export const options = {
  stages: [
    { duration: '2m', target: 200 },
    { duration: '5m', target: 1000 },
    { duration: '2m', target: 0 },
  ],
  thresholds: { http_req_duration: ['p(95)<500'], http_req_failed: ['rate<0.01'] },
};
export default function () {
  const res = http.get('https://staging.example.com/api/products');
  check(res, { 'status 200': (r) => r.status === 200 });
  sleep(1);
}k6 run load.js
wrk -t8 -c500 -d60s https://staging.example.com/api/products
# while it runs, watch the servers
htop
ss -s
sudo tail -f /var/log/nginx/error.log
psql -c "select state, count(*) from pg_stat_activity group by state;"The first layer that logs errors or reaches 100% is your bottleneck. Fix it, then test again.
Step 2: Tune Nginx for many connections
# /etc/nginx/nginx.conf
worker_processes auto;
worker_rlimit_nofile 65535;
events {
    worker_connections 8192;
    multi_accept on;
}
http {
    keepalive_timeout 30s;
    upstream app {
        least_conn;
        server 10.0.0.11:3000;
        server 10.0.0.12:3000;
        keepalive 64;
    }
    server {
        location / {
            proxy_http_version 1.1;
            proxy_set_header Connection "";
            proxy_pass http://app;
            proxy_read_timeout 30s;
        }
    }
}
Also raise the file descriptor limit for the service (LimitNOFILE=65535 in the systemd unit). If you already see gateway timeouts, read how to fix Nginx 504 Gateway Timeout.
Step 3: Size application workers correctly
For Laravel on PHP-FPM, calculate pm.max_children from available RAM divided by average worker memory (check with ps -ylC php-fpm8.3 --sort:rss).
; /etc/php/8.3/fpm/pool.d/www.conf
pm = dynamic
pm.max_children = 60
pm.start_servers = 15
pm.min_spare_servers = 10
pm.max_spare_servers = 30
pm.max_requests = 1000
For Node.js and Next.js, run one process per CPU core with PM2 cluster mode or multiple containers, and move CPU-heavy work to worker threads or a queue.
pm2 start dist/server.js -i max --name api
pm2 monit
Step 4: Put PgBouncer in front of PostgreSQL
PgBouncer in transaction mode lets thousands of client connections share a small number of real database connections.
; /etc/pgbouncer/pgbouncer.ini
[databases]
appdb = host=127.0.0.1 port=5432 dbname=appdb

[pgbouncer]
listen_port = 6432
pool_mode = transaction
max_client_conn = 5000
default_pool_size = 40
reserve_pool_size = 10
Point the app at port 6432. In Laravel with transaction pooling, disable emulated prepares if you hit prepared statement errors. Then fix slow queries with EXPLAIN (ANALYZE, BUFFERS) and add the indexes it reveals.
Step 5: Cache hot reads in Redis
// Laravel
$products = Cache::remember('products:home', 60, fn () =>
    Product::where('active', true)->orderBy('rank')->limit(50)->get()
);

// Node.js (ioredis)
const cached = await redis.get('products:home');
if (cached) return JSON.parse(cached);
const rows = await db.query('SELECT * FROM products WHERE active = true LIMIT 50');
await redis.set('products:home', JSON.stringify(rows.rows), 'EX', 60);
When many requests miss the cache at once, they can all hit the database together; see Redis cache stampede prevention for locking and early refresh patterns. Static assets and public pages should also be served from a CDN.
Step 6: Move slow work to queues and make the app stateless
// Laravel: dispatch instead of doing it in the request
SendInvoiceEmail::dispatch($invoice);

# .env  - shared state in Redis so any instance can serve any user
SESSION_DRIVER=redis
CACHE_STORE=redis
QUEUE_CONNECTION=redis

# run workers separately
php artisan queue:work redis --tries=3 --max-time=3600
Once sessions, cache and uploads live outside the app server (Redis, object storage), you can add instances behind the load balancer. This is horizontal scaling, and it is how scalable APIs grow past a single machine.
Code and Commands Quick Reference
# check connection usage
psql -c "show max_connections;"
psql -c "select count(*) from pg_stat_activity;"

# PHP-FPM status (enable pm.status_path = /status)
curl -s http://127.0.0.1/status

# open files limit
ulimit -n
cat /proc/$(pgrep -o nginx)/limits | grep "open files"

# Docker: scale stateless app containers
docker compose up -d --scale app=4
Verification
Run the same k6 test again and compare:
- p95 latency stays under your threshold as virtual users rise.
http_req_failedstays under 1% with no 502 or 504 responses.- Nginx and PHP-FPM logs show no
worker_connectionsorpm.max_childrenwarnings. - PostgreSQL active connections stay well below
max_connections, and Redis hit rate (redis-cli info stats | grep keyspace) is high.
Prevention
- Add a load test to your release process before marketing campaigns or sales events.
- Monitor p95 latency, error rate, DB connections and queue length with alerts.
- Set timeouts everywhere: HTTP clients, DB statements (
statement_timeout), and proxies. - Paginate API responses and avoid N+1 queries.
- Keep app servers stateless so you can autoscale.
- Use rate limiting to protect expensive endpoints from abuse.
FAQs
How many concurrent users can one server handle?
It depends on request duration, not just hardware. Measure it with a load test; a server with fast cached responses handles far more users than one running slow queries.
What is the best way to build high concurrency web applications?
Keep requests short, cache reads, pool database connections, push slow work to queues, and keep the app stateless so you can scale horizontally.
Should I increase PostgreSQL max_connections to handle concurrent users?
Only slightly. Each connection uses memory; a pooler like PgBouncer is the better fix.
How do I make scalable APIs in Laravel or Node.js?
Use Redis for cache and sessions, queue heavy tasks, index your queries, and run multiple instances behind Nginx or a load balancer.
Is vertical scaling enough?
It is a quick fix, but it has a ceiling and a single point of failure. Horizontal scaling with stateless instances lasts longer.
Comments
Join the discussion. Replies load on demand, up to 5 levels.
0 threads
No comments yet
Be the first to start the conversation.