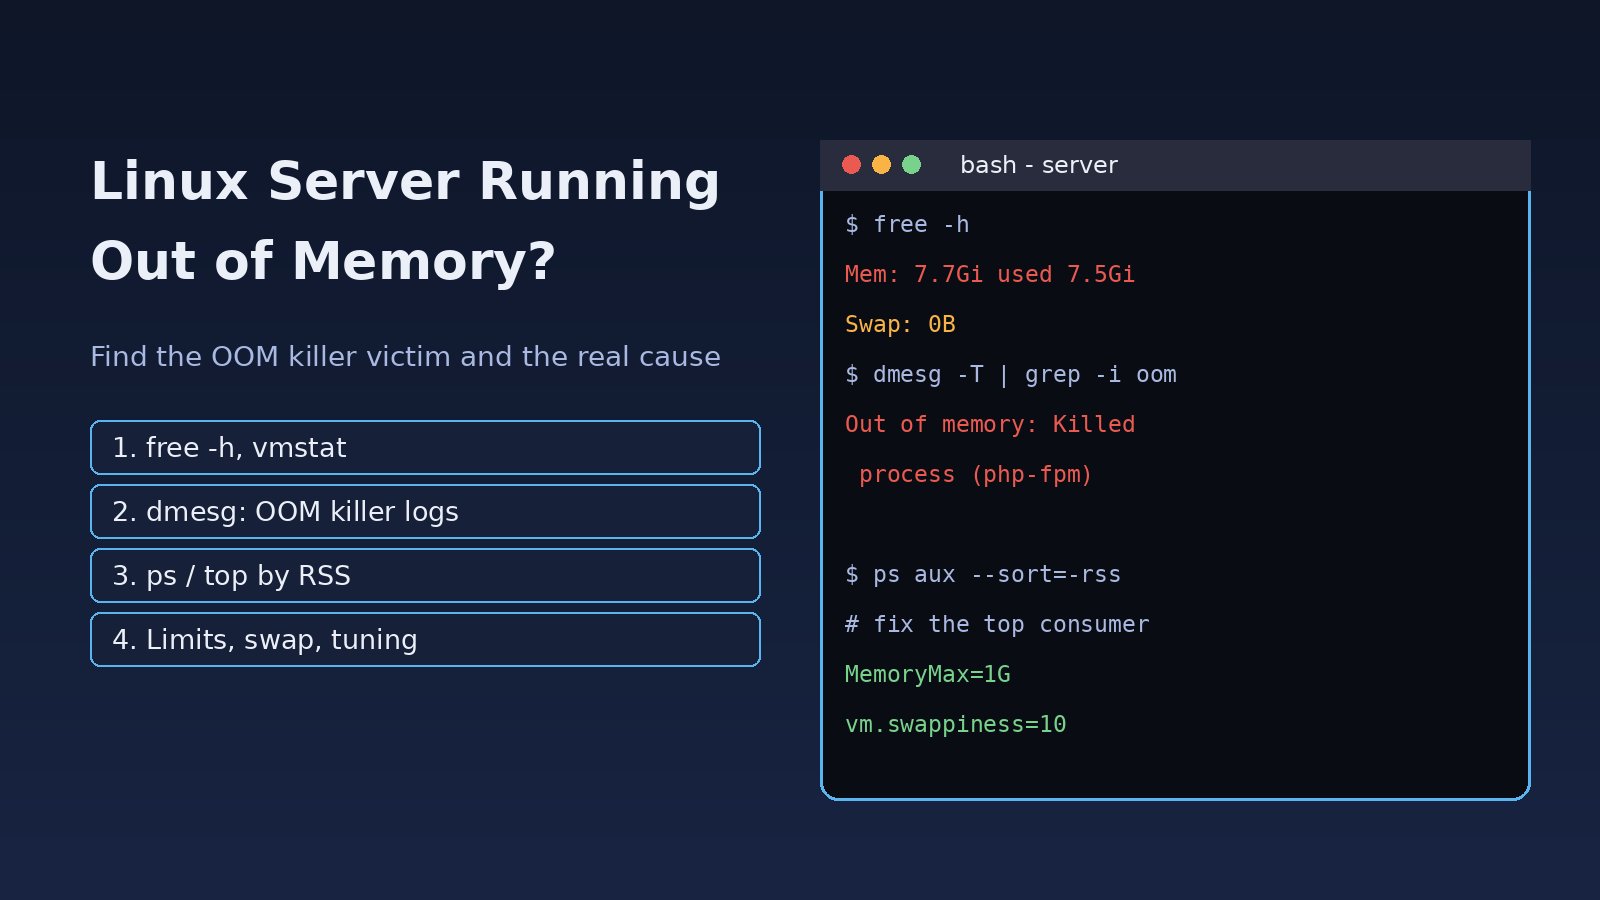
Your API suddenly returns 502 errors, PostgreSQL restarts on its own, a Laravel queue worker disappears, or SSH becomes so slow you can barely type. When a Linux server is running out of memory, the kernel starts reclaiming cache, pushes pages to swap and, as a last resort, the OOM killer terminates a process to keep the system alive. This guide walks through linux out of memory troubleshooting step by step: how to confirm the problem, read the OOM killer logs, find the process that is really using the RAM, and fix it so it does not come back.
Problem: Linux Out of Memory on a Production Server
Linux tries hard to use all available RAM. Spare memory is used for the page cache, so a server that shows almost no "free" memory is often perfectly healthy. The real problem starts when applications need more memory than the server can provide, even after the kernel drops cache and uses swap. At that point the kernel either stalls (heavy swapping) or invokes the OOM (Out Of Memory) killer, which picks a process based on its oom_score and kills it with SIGKILL.
On typical web stacks, the victim is usually the largest process: a PostgreSQL backend, a Node.js or Next.js server, PHP-FPM workers, Redis, Elasticsearch or a Java service.
Symptoms
- Kernel log lines such as
Out of memory: Killed process 2314 (php-fpm8.2) total-vm:..., anon-rss:... Memory cgroup out of memory: Killed process ...when a container or systemd service hit its own limit- A service exits with status
9/KILL, or a container exits with code 137 - PostgreSQL logs
server process (PID ...) was terminated by signal 9: Killedand thenterminating any other active server processes - Applications log
Cannot allocate memoryor fail to fork (fork: Cannot allocate memory) - Very high load average with low CPU usage, slow SSH and high disk I/O from swapping
Root Cause
1. Too many workers for the available RAM
The most common cause is simple arithmetic. If each PHP-FPM worker uses 80 MB and pm.max_children is 50, PHP alone can need about 4 GB. Add PostgreSQL shared_buffers plus per-connection work_mem, Redis, Node.js processes and queue workers, and a 4 GB VPS runs out under peak traffic.
2. A memory leak
Long-running processes such as Node.js servers, Laravel queue workers (queue:work) and custom daemons can slowly grow until they take all the RAM. The pattern is easy to recognise: memory climbs steadily between restarts and never returns to its starting level.
3. No swap or a very small swap
Many cloud images ship without swap. Swap is not a replacement for RAM, but without it a short spike goes straight to the OOM killer instead of being absorbed.
4. Cgroup or container limits
Docker --memory, Kubernetes limits and systemd MemoryMax= create a memory limit for one group of processes. The host can have plenty of free RAM while a container is still OOM killed inside its own limit.
5. Heavy queries and large in-memory operations
Loading a huge result set into memory (for example Model::all() on a large table, or a big export built in one array), a PostgreSQL query with a large sort or hash per connection, or image processing on big files can cause sudden spikes.
Step-by-Step Linux Memory Troubleshooting
Step 1: Confirm the server is really out of memory
free -h
#               total   used   free   shared  buff/cache  available
# Mem:          7.7Gi   7.3Gi  120Mi  210Mi   310Mi       180Mi
# Swap:            0B      0B     0B

vmstat 1 5      # watch si/so (swap in/out) and the 'free' column
cat /proc/meminfo | grep -E 'MemTotal|MemAvailable|SwapTotal|SwapFree|Committed_AS'
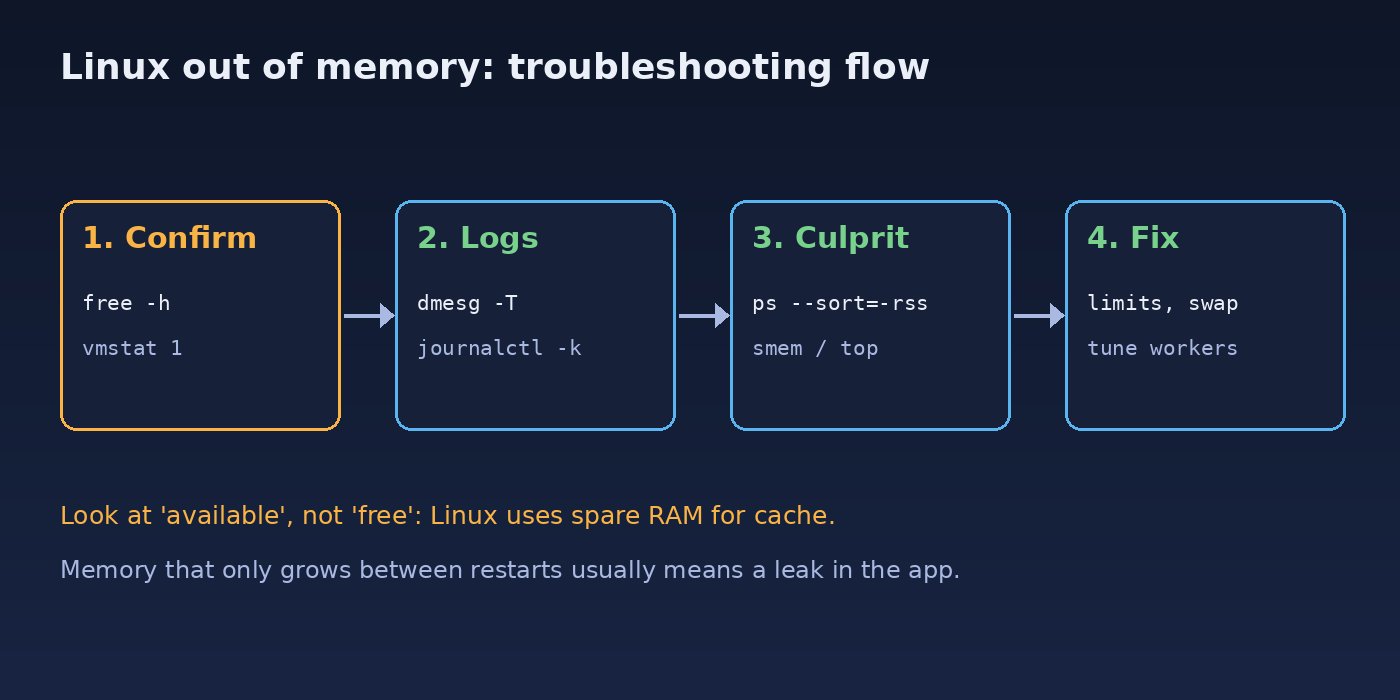
Look at the available column, not free. Low "free" with a large "buff/cache" is normal. Low "available" plus non-zero si/so values in vmstat means the server is under real memory pressure.
Step 2: Check the OOM killer logs
sudo dmesg -T | grep -iE 'out of memory|oom-kill|killed process'
sudo journalctl -k --since "24 hours ago" | grep -i -A2 "out of memory"

# on older or non-systemd systems
sudo grep -i "killed process" /var/log/syslog /var/log/kern.log /var/log/messages 2>/dev/null
A typical entry looks like this:
Out of memory: Killed process 2314 (node) total-vm:4821340kB, anon-rss:3102456kB, file-rss:0kB, shmem-rss:0kB, UID:1000 pgtables:6800kB oom_score_adj:0It tells you which process was killed and how much resident memory (anon-rss) it was using. If the line starts with Memory cgroup out of memory, the limit came from a container or systemd service, not from the whole server. Keep in mind the victim is not always the cause: the OOM killer picks the process with the highest score, which is often the biggest one, even if another process caused the growth.
Step 3: Find which process is using the memory
# top processes by resident memory (RSS)
ps aux --sort=-rss | head -15

# memory grouped by command name, in MB
ps -eo rss,comm --no-headers | awk '{m[$2]+=$1} END {for (c in m) printf "%8.0f MB  %s\n", m[c]/1024, c}' | sort -rn | head

# interactive view: press Shift+M in top to sort by memory
top
Grouping by command matters. Fifty PHP-FPM workers at 70 MB each will not look scary one at a time, but together they use 3.5 GB. If you have smem installed, smem -tk -s pss gives a more accurate number for shared memory.
Step 4: Check memory per service and per container
systemd-cgtop -m                     # memory per systemd service / slice
systemctl status php8.2-fpm | grep Memory
docker stats --no-stream             # memory usage and limit per container
This quickly shows whether one service is the outlier. For containers that exit with 137, see how to fix Docker exit code 137.
Step 5: Watch memory over time to spot a leak
pid=$(pgrep -o -f "queue:work")
while true; do echo "$(date +%T) $(ps -o rss= -p $pid) KB"; sleep 60; done
If RSS rises steadily and never drops, the process is leaking. For Node.js heap problems, the fixes in JavaScript heap out of memory apply.
How to Fix a Linux Server Running Out of Memory
Fix 1: Size workers to fit your RAM
Measure the average memory per worker and set limits that fit. For PHP-FPM:
# average PHP-FPM worker size in MB
ps -C php-fpm8.2 -o rss= | awk '{s+=$1; n++} END {print s/n/1024 " MB avg, " n " workers"}'

# /etc/php/8.2/fpm/pool.d/www.conf
pm = dynamic
pm.max_children = 20        ; (RAM reserved for PHP) / (avg worker MB)
pm.max_requests = 500       ; recycle workers to contain slow leaks
For PostgreSQL, keep max_connections realistic and use a pooler such as PgBouncer instead of hundreds of direct connections, because every backend and every sort that uses work_mem takes its own memory.
Fix 2: Add swap as a safety buffer
sudo fallocate -l 2G /swapfile
sudo chmod 600 /swapfile
sudo mkswap /swapfile
sudo swapon /swapfile
echo '/swapfile none swap sw 0 0' | sudo tee -a /etc/fstab

# prefer RAM, use swap only under pressure
echo 'vm.swappiness=10' | sudo tee /etc/sysctl.d/99-swappiness.conf
sudo sysctl --system
Swap gives you time to react to a spike. If the server swaps heavily all the time, you still need more RAM or fewer processes.
Fix 3: Put memory limits on services
Limiting the non-critical services protects the important ones. With systemd:
sudo systemctl edit myworker.service

[Service]
MemoryHigh=800M     # throttle and reclaim above this
MemoryMax=1G        # hard limit, OOM kill inside this service only

sudo systemctl daemon-reload && sudo systemctl restart myworker.service
For Docker, use --memory=1g or mem_limit / deploy.resources.limits.memory in Compose. For Redis, set maxmemory and an eviction policy so it cannot grow without limit; see Redis memory optimization.
Fix 4: Protect critical processes from the OOM killer
# lower values make a process less likely to be killed (-1000 disables it)
sudo systemctl edit postgresql.service
[Service]
OOMScoreAdjust=-500

# check the current score of a process
cat /proc/$(pgrep -o postgres)/oom_score
Use this carefully. If you protect everything, the kernel has nothing left to kill and the whole server can freeze.
Fix 5: Fix leaks and heavy code paths
<?php
// Laravel: process large tables in chunks instead of loading everything
User::where('active', true)->chunkById(1000, function ($users) {
    foreach ($users as $user) {
        // ...
    }
});

// restart queue workers regularly to release leaked memory
// php artisan queue:work --max-jobs=1000 --max-time=3600 --memory=256
In Node.js, look for caches without size limits, global arrays that keep growing and event listeners added on every request. Set --max-old-space-size to a value below the container or service limit so V8 garbage-collects before the kernel steps in.
Verification
free -h                                   # 'available' should stay healthy at peak
swapon --show                              # swap is active
vmstat 5                                   # si/so near zero most of the time
sudo dmesg -T | grep -i "killed process"   # no new OOM kills
systemctl show myworker.service -p MemoryCurrent -p MemoryMax
Check again during your busiest hours and after a few days. Memory that stays flat between restarts and no new OOM entries mean the fix worked.
Prevention
- Monitor available memory, swap usage and OOM events, and alert before memory is exhausted (for example at 85%).
- Do the worker arithmetic for PHP-FPM, Node.js clusters, queue workers and database connections before each scale-up.
- Give every container and background service an explicit memory limit.
- Recycle long-running workers with
pm.max_requests,--max-jobsor a process manager restart policy. - Load test new features that process large files or exports before they reach production.
- Keep a small swap file on every server as a buffer.
FAQs
How do I know if the OOM killer killed my process?
Run sudo dmesg -T | grep -i "killed process" or journalctl -k | grep -i "out of memory". The log shows the PID, process name and memory it used. A systemd service killed this way usually shows status=9/KILL.
Why does free show almost no free memory when the server is fine?
Linux uses unused RAM as page cache to speed up disk access, and it releases that cache when applications need it. The available column is the real measure of how much memory applications can still use.
Should I disable the OOM killer?
No. Without it, a server that runs out of memory can hang completely. Instead, fix the memory usage, add limits to non-critical services and lower OOMScoreAdjust only for the processes that must survive.
How much swap should a Linux server have?
For most web and database servers, 1 to 4 GB of swap with vm.swappiness set low is a practical buffer. It is meant to absorb short spikes, not to run the workload.
Is clearing the cache with drop_caches a fix?
echo 3 > /proc/sys/vm/drop_caches only frees cache that the kernel would have released anyway. It does not fix an out of memory problem and can slow the server down while the cache refills.
Comments
Join the discussion. Replies load on demand, up to 5 levels.
0 threads
No comments yet
Be the first to start the conversation.