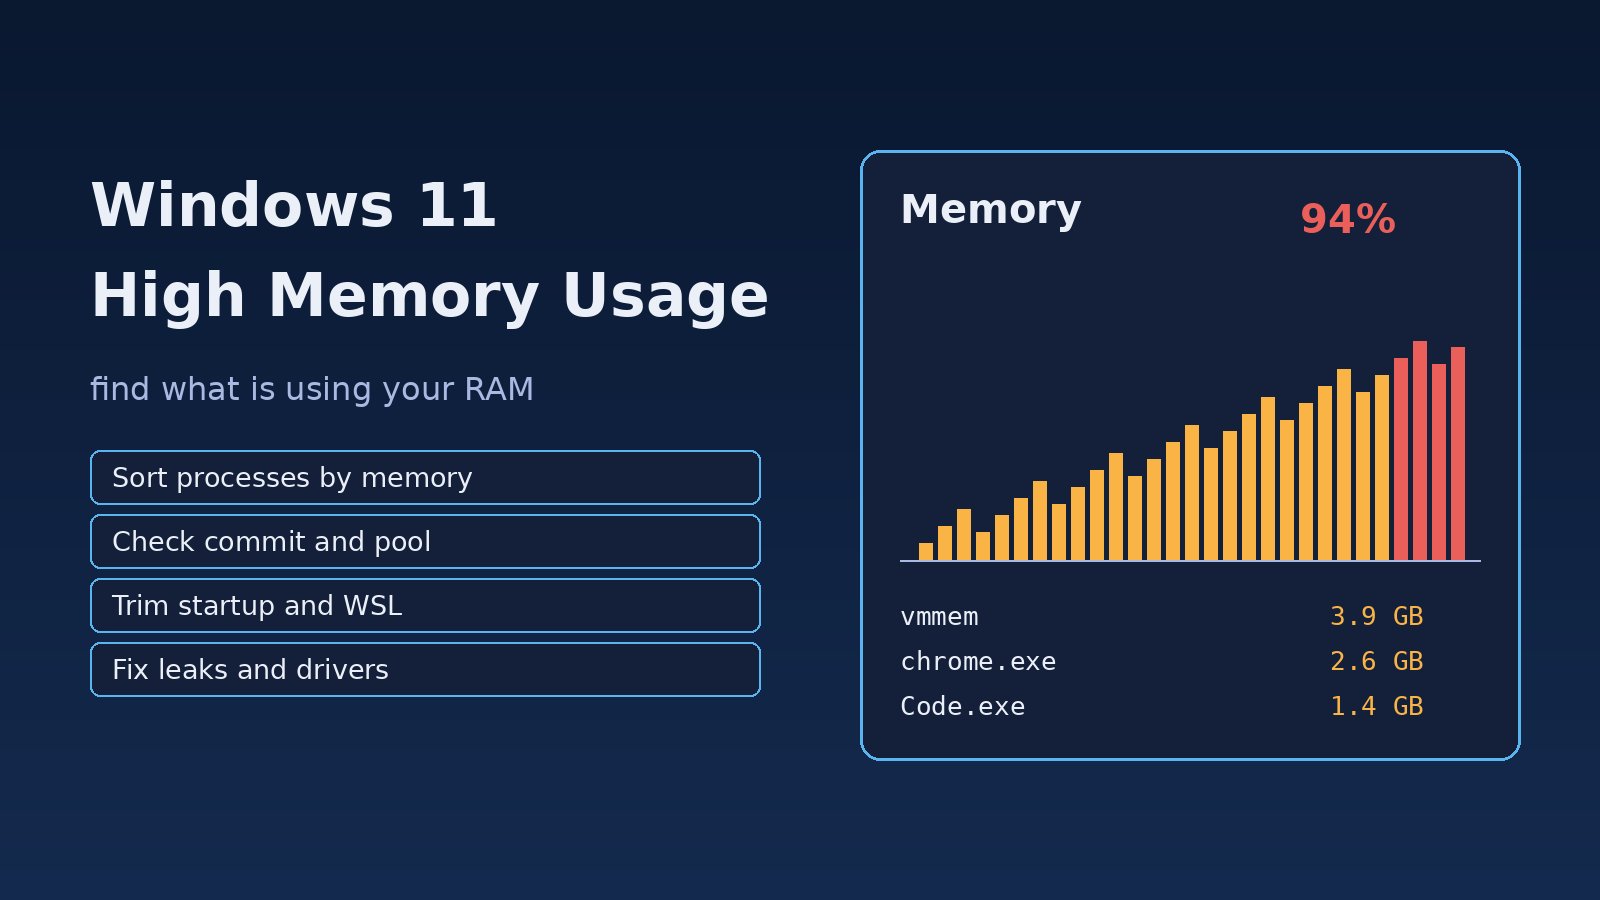
Your laptop has 16 GB of RAM, you only have a browser, VS Code and Docker open, and Task Manager still says memory is at 90% or more. Apps freeze for a second when you switch windows, the fan spins up and the disk light never stops. Windows 11 high memory usage is one of the most common performance complaints, but high RAM use on its own is not always a fault. Windows deliberately uses free memory for caching. The real problem starts when the system runs short of available memory and begins paging to disk. This guide shows you how to tell the difference, find exactly what is holding the memory, and fix it with built-in tools like Task Manager, Resource Monitor, PowerShell and Windows Memory Diagnostic.
Problem: Windows 11 High Memory Usage Slows Everything Down
When physical RAM fills up, Windows moves less-used pages to the page file on disk. Reading them back is much slower than reading RAM, so the whole machine feels sluggish. If even the page file cannot cover what programs have asked for, Windows starts warning that the computer is low on memory and may close apps to recover.
For developers this happens often, because WSL 2, Docker Desktop, Android emulators, IDEs with language servers and dozens of browser tabs are all heavy memory consumers running at the same time.
Symptoms of High RAM Usage in Windows 11
- Task Manager's Performance tab shows Memory at 85-100% even when you are not doing much.
- Switching between apps or browser tabs is slow, and tabs reload when you return to them.
- The "Your computer is low on memory" warning appears, or apps close on their own.
- Disk activity stays high because of constant paging.
- Memory use climbs steadily over hours or days and only drops after a restart, which points to a memory leak.
- A process such as
vmmem,vmmemWSL,chrome.exe,msedge.exe,Code.exeornode.exesits at the top of the list using several gigabytes.
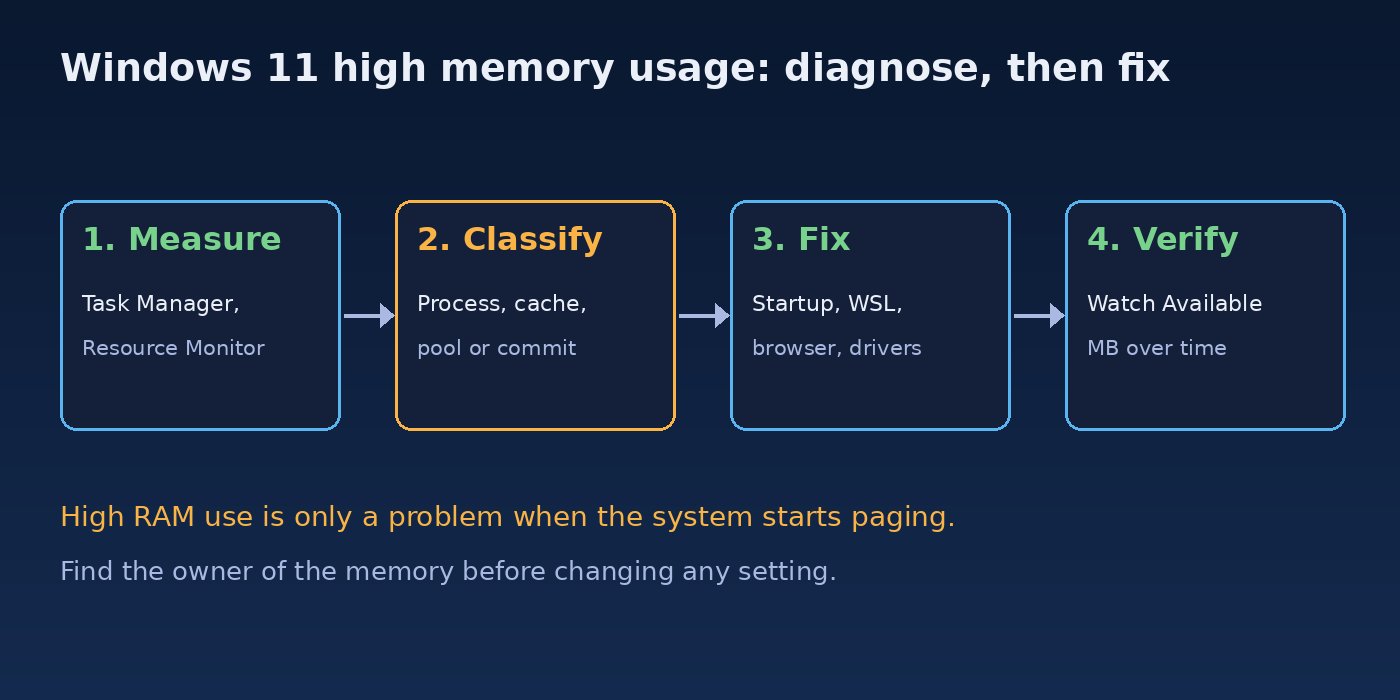
Root Cause: Why Windows RAM Usage Is High
- Too many heavy apps at once. Browsers, Electron apps (VS Code, Slack, Teams), IDEs and virtual machines each reserve hundreds of megabytes to several gigabytes.
- WSL 2 and Docker Desktop. WSL 2 runs a lightweight virtual machine that appears as
vmmemorvmmemWSL. By default it can take up to half of your physical RAM and holds on to Linux file cache. - Startup programs and background apps that launch with Windows and stay resident even when you never use them.
- Memory leaks in an app. A process that keeps growing and never releases memory, common in long-running Node.js dev servers, browser tabs and some tray utilities.
- Driver leaks in kernel memory. A faulty driver can leak paged or non-paged pool memory. This does not show up under any process in Task Manager, which makes it confusing.
- Malware such as cryptominers hiding in background processes.
- Hardware or configuration limits, for example 8 GB of RAM with a modern developer workload, a disabled or tiny page file, or faulty RAM.
Note that a large "Cached" or "Standby" value is normal. Windows gives that memory back instantly when a program needs it, so it is not the problem.
Step-by-Step Solution to Fix Windows 11 High Memory Usage
Step 1: Check what is really using memory in Task Manager
Press Ctrl + Shift + Esc, open Processes and click the Memory column to sort. Then open Performance > Memory and note three numbers: In use, Available and Committed. If Available is very low and Committed is close to its limit, you have real memory pressure. If In use is high but Available is still a few gigabytes, Windows is simply caching and you are fine.
For more detail, open Resource Monitor with resmon, go to the Memory tab and look at Commit (KB) and Working Set (KB) per process, plus the colored bar showing In Use, Modified, Standby and Free.
Step 2: List the top memory consumers with PowerShell
PowerShell gives you a quick, copyable snapshot of the heaviest processes and overall available memory:
# Top 15 processes by working set (RAM in MB)
Get-Process | Sort-Object WorkingSet64 -Descending |
  Select-Object -First 15 Name, Id,
  @{n='RAM_MB';e={[math]::Round($_.WorkingSet64/1MB)}},
  @{n='Private_MB';e={[math]::Round($_.PrivateMemorySize64/1MB)}}

# Total and free physical memory
Get-CimInstance Win32_OperatingSystem |
  Select-Object @{n='Total_GB';e={[math]::Round($_.TotalVisibleMemorySize/1MB,1)}},
                @{n='Free_GB';e={[math]::Round($_.FreePhysicalMemory/1MB,1)}}
Private memory that keeps growing between two snapshots taken a few minutes apart is a strong sign of a leak in that process.
Step 3: Limit WSL 2 and Docker Desktop memory
If vmmem or vmmemWSL is at the top, cap the WSL 2 virtual machine. Create or edit %UserProfile%\.wslconfig:
[wsl2]
memory=6GB
processors=4
swap=4GB

[experimental]
autoMemoryReclaim=gradual
Then restart WSL so the limit takes effect. Docker Desktop with the WSL 2 backend uses the same limit.
wsl --shutdown
wsl --status
Inside Linux you can also stop containers you are not using with docker ps and docker stop <name>. If a container itself is running out of memory, see our guide on fixing JavaScript heap out of memory errors for Node.js-specific limits.
Step 4: Disable unnecessary startup apps
Open Task Manager > Startup apps and disable anything you do not need at login, such as updaters, chat apps and game launchers. You can also review them from PowerShell:
Get-CimInstance Win32_StartupCommand | Select-Object Name, Command, LocationIn Settings > Apps > Installed apps, uninstall tools you no longer use, especially old system "optimizers" and tray utilities.
Step 5: Reduce browser and editor memory usage
- In Chrome or Edge, turn on Memory Saver (Chrome: Settings > Performance; Edge: Settings > System and performance, sleeping tabs).
- Use the browser's own task manager (
Shift + Escin Chrome and Edge) to find the tab or extension using the most memory, and remove extensions you do not need. - In VS Code, run Developer: Open Process Explorer to see which extension or language server is heavy, and disable extensions per workspace.
- Restart long-running dev servers (
npm run dev, watchers, Laravel queue workers on Windows) that keep growing over the day.
Step 6: Check for kernel memory leaks from drivers
If Task Manager shows high usage but no process adds up to it, look at Performance > Memory for Paged pool and Non-paged pool. A non-paged pool of several gigabytes that keeps growing usually means a driver leak. Microsoft's Sysinternals RAMMap tool shows where every page of physical memory is used, and poolmon from the Windows Driver Kit shows which pool tag is growing. Update or roll back the network, VPN, antivirus and storage drivers first, since those are the usual suspects. Driver problems can also cause crashes, which our Windows 11 blue screen fix guide covers.
Step 7: Repair system files, scan for malware and test RAM
:: Run in an elevated Command Prompt
sfc /scannow
DISM /Online /Cleanup-Image /RestoreHealth

:: Full Microsoft Defender scan
"%ProgramFiles%\Windows Defender\MpCmdRun.exe" -Scan -ScanType 2

:: Schedule Windows Memory Diagnostic on next restart
mdsched.exe
If system files are damaged because an update failed halfway, finish or repair the update first, as explained in our guide on a Windows 11 update stuck at 0% or 100%.
Step 8: Set a sensible page file
Open SystemPropertiesAdvanced, then Performance > Settings > Advanced > Virtual memory > Change. Unless you have a specific reason, choose Automatically manage paging file size for all drives. Disabling the page file does not save memory; it only means apps crash sooner when RAM runs out.
Step 9: Memory optimization through hardware
If your normal workload genuinely needs more than you have, for example WSL, Docker, an IDE and a browser all running together on 8 GB, no setting will fix it. Upgrading to 16 or 32 GB is the real memory optimization in that case.
Verification: Confirm Memory Usage Is Back to Normal
After the fixes, restart and use the machine normally for an hour. Then check that Available memory stays above a comfortable margin and does not keep falling. You can log it over time:
# Sample available memory and committed bytes every 60 seconds, 30 times
typeperf "\Memory\Available MBytes" "\Memory\Committed Bytes" "\Memory\Pool Nonpaged Bytes" -si 60 -sc 30
A flat line means the problem is solved. A steadily dropping Available value, or a growing non-paged pool, means a leak is still there and you should repeat Steps 2 and 6 to find it.
Prevention: Keep Windows RAM Usage Under Control
- Keep the
.wslconfigmemory limit in place and runwsl --shutdownwhen you finish container work. - Review startup apps after installing new software.
- Keep drivers updated from the PC or device manufacturer, and avoid unknown "RAM cleaner" tools.
- Restart long-running dev servers and the PC itself regularly, at least after updates.
- Close or sleep browser tabs you are not using and keep extensions to a minimum.
- Watch Task Manager's Memory graph occasionally so a slow leak is caught early.
FAQs
Is 70-80% RAM usage normal in Windows 11?
It can be. Windows uses spare memory for cache and releases it when needed. It only becomes a problem when Available memory is low, the system pages heavily or you see low-memory warnings.
Why is Windows RAM usage high with nothing open?
Startup apps, background services, cached files and sometimes a driver leaking kernel pool memory. Check Startup apps, sort processes by memory and compare the non-paged pool value.
What is vmmem and why does it use so much memory?
vmmem or vmmemWSL is the WSL 2 virtual machine, which also runs Docker Desktop's WSL backend. Limit it with the memory setting in .wslconfig and run wsl --shutdown to release it.
Does disabling SysMain fix high memory usage?
SysMain preloads frequently used apps into cache memory that Windows can free when needed. Disabling it rarely fixes real memory pressure, so find the process or driver using the memory first.
How do I find a memory leak in Windows 11?
Take two snapshots of private memory per process a few minutes apart with PowerShell or Resource Monitor. The process that keeps growing is leaking. If no process grows but the non-paged pool does, a driver is leaking.
Comments
Join the discussion. Replies load on demand, up to 5 levels.
0 threads
No comments yet
Be the first to start the conversation.