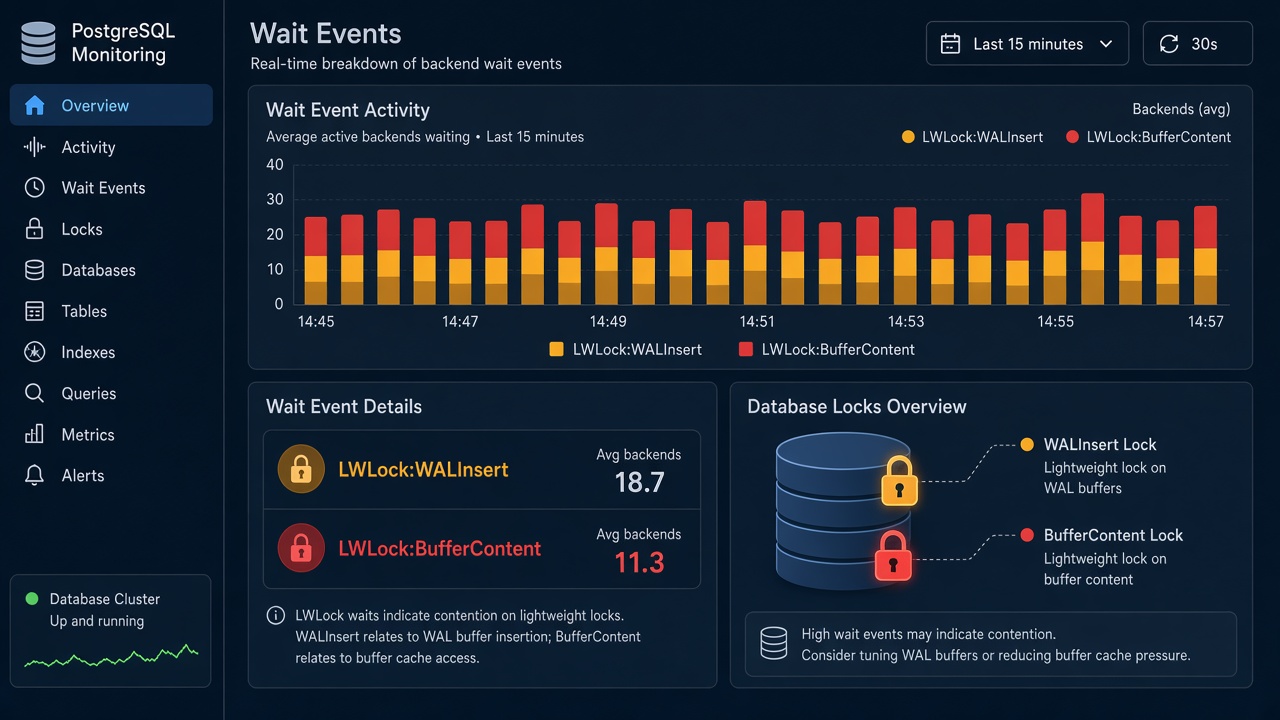
Your monitoring dashboard lights up with LWLock:WALInsert or LWLock:BufferContent, and queries that usually finish in milliseconds start stacking up. A postgresql lwlock wait means a backend is waiting on a PostgreSQL lightweight lock: a short-lived latch that protects shared memory structures such as WAL buffers and shared buffer pages. This guide explains what those waits mean, how to find which sessions and queries cause them, and how to reduce contention without guessing at random postgresql.conf knobs.
Problem: PostgreSQL LWLock Wait Events
PostgreSQL reports wait events in pg_stat_activity. When wait_event_type is LWLock, the backend is blocked on a lightweight lock rather than a heavyweight table lock, client I/O or CPU. Lightweight locks are normal; a spike that lasts minutes and correlates with latency is the problem.
You will see this on busy Laravel, Node.js or ERP databases during bulk imports, chatty ORMs, poorly indexed updates, checkpoint storms or too many concurrent writers all hitting the same hot pages and WAL path.
Symptoms
pg_stat_activityshows many rows withwait_event_type = 'LWLock'and names likeWALInsert,BufferContent,BufferMappingorLockManager.- APM or
pg_stat_statementsshows rising mean time for previously fastINSERT/UPDATEstatements. - CPU is not saturated, yet throughput drops: backends are waiting, not computing.
- WAL directory growth accelerates while writers stall (often alongside WALInsert waits).
- Connection pools fill up because sessions hold connections while waiting.
Root Cause
Lightweight locks serialize access to shared memory. Contention means too many backends need the same structure at once.
WALInsert wait
Backends must reserve space in the WAL buffers before writing WAL records. Under heavy concurrent commits, they queue on the WALInsert LWLock. Small transactions, synchronous commit, tiny wal_buffers, or a slow WAL disk make the queue longer.
BufferContent wait
Each shared buffer page has a content lock. Hot rows updated by many sessions (counters, status flags, a single parent row) force backends to wait for BufferContent. Missing indexes that turn updates into sequential scans multiply the pages touched.
Other common LWLocks
BufferMapping: looking up or inserting buffer-cache entries under churn.LockManager: heavyweight lock hash table pressure from many locks.ProcArray/XidGen: snapshot and XID assignment under extreme concurrency.
Idle-in-transaction sessions do not hold LWLocks by themselves, but they hold heavyweight locks and snapshots that make other work pile up until you see LWLock waits as a side effect. Clean those up first when they appear together; see PostgreSQL idle in transaction.
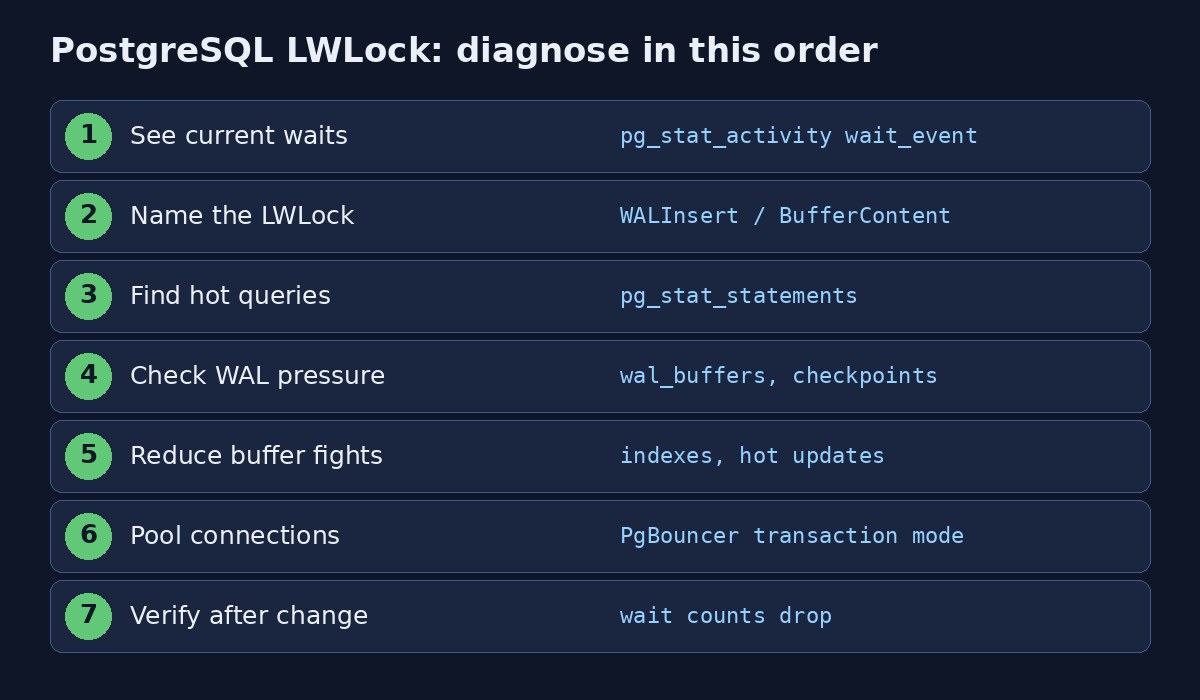
Step-by-Step Fix
Step 1: List current LWLock waiters
SELECT pid,
       usename,
       application_name,
       wait_event_type,
       wait_event,
       state,
       now() - query_start AS query_age,
       left(query, 120) AS query
FROM pg_stat_activity
WHERE wait_event_type = 'LWLock'
ORDER BY query_start;
Group by event name to see which lock dominates:
SELECT wait_event, count(*) AS backends
FROM pg_stat_activity
WHERE wait_event_type = 'LWLock'
GROUP BY wait_event
ORDER BY backends DESC;
Step 2: Confirm it is not a one-second blip
Sample a few times a second apart, or use pg_wait_sampling / your APM if installed. A single snapshot can catch normal micro-waits. Sustained counts during a latency incident are what matter.
Step 3: Find the queries causing WALInsert wait
-- top writers by WAL-related activity (PostgreSQL 13+)
SELECT queryid,
       calls,
       round(total_exec_time::numeric, 1) AS total_ms,
       round(mean_exec_time::numeric, 2) AS mean_ms,
       rows,
       left(query, 100) AS query
FROM pg_stat_statements
ORDER BY total_exec_time DESC
LIMIT 20;
Look for chatty single-row commits inside loops, ORM save() per item, or bulk loads without COPY. Batch writes and use fewer round-trips.
Step 4: Ease WALInsert pressure
SHOW wal_buffers;
SHOW synchronous_commit;
SHOW checkpoint_timeout;
SHOW max_wal_size;

-- often safe starting point on dedicated DB hosts with enough RAM
-- (restart required for wal_buffers in many versions)
ALTER SYSTEM SET wal_buffers = '64MB';
-- only if your RPO allows it for non-critical sessions:
-- ALTER SYSTEM SET synchronous_commit = 'off';  -- or 'local'
SELECT pg_reload_conf();
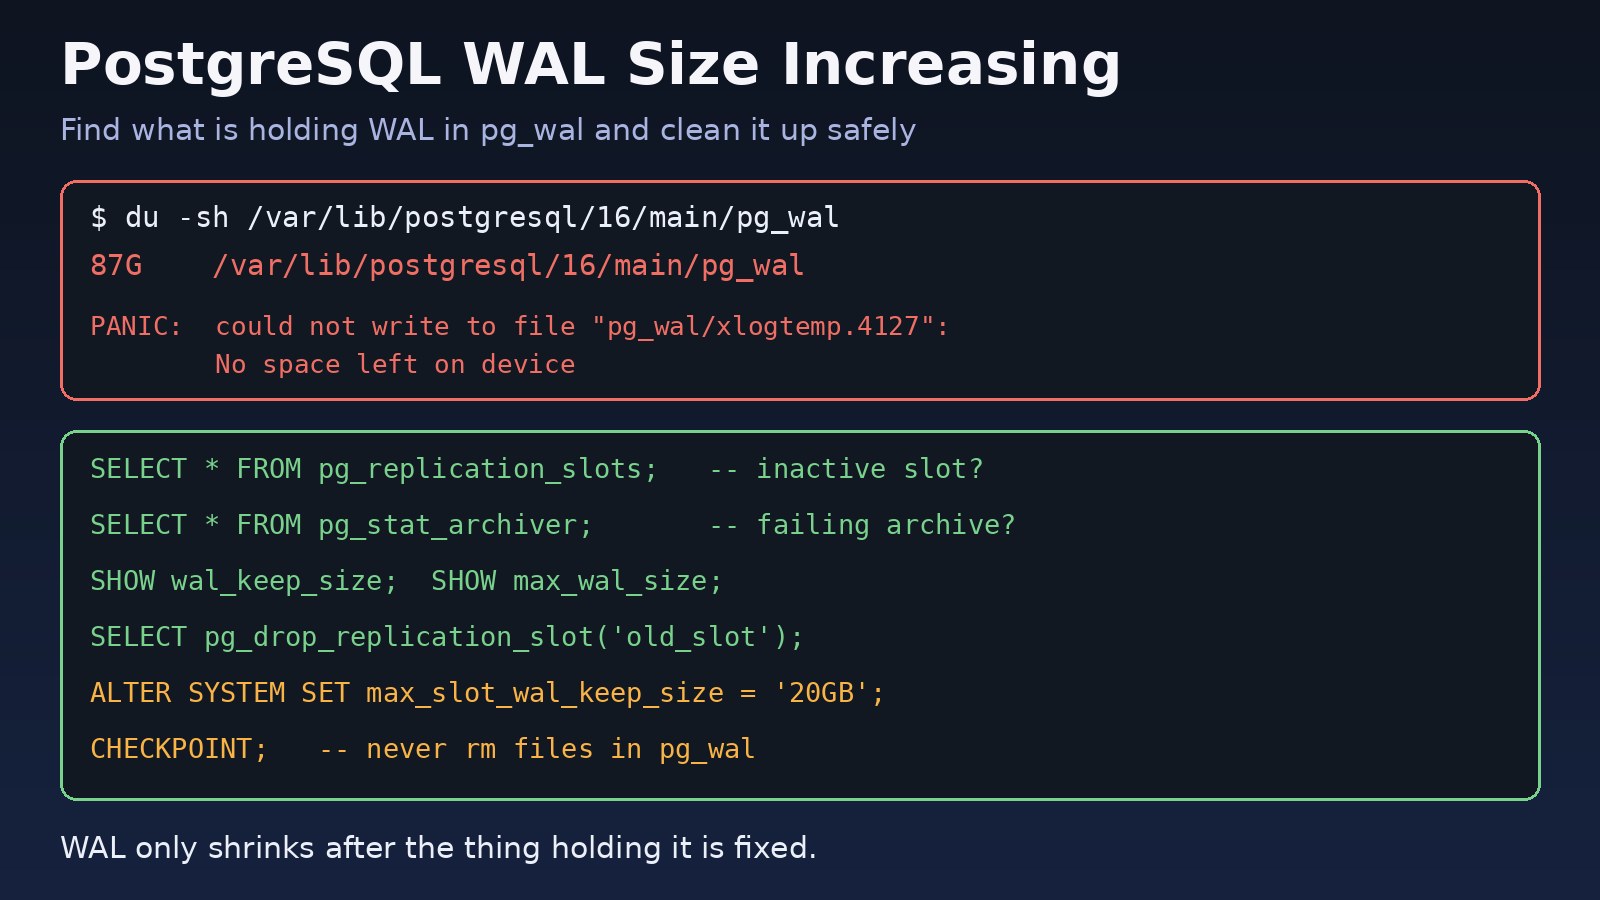
Put WAL on fast storage. If WAL files keep growing after writers recover, follow PostgreSQL WAL size increasing for slots, archives and checkpoints.
Step 5: Fix BufferContent wait hotspots
-- pages / tables under heavy updates (extension required)
-- CREATE EXTENSION IF NOT EXISTS pgstattuple;  -- optional
SELECT relname,
       n_tup_upd,
       n_tup_hot_upd,
       n_live_tup,
       n_dead_tup
FROM pg_stat_user_tables
ORDER BY n_tup_upd DESC
LIMIT 20;- Add or fix indexes so updates touch fewer pages.
- Avoid updating a single "global counter" row from every request; use inserts into an events table and aggregate later, or
UPDATE ... WHERE id = ... RETURNINGwith less frequency. - Keep
fillfactorappropriate on heavily updated indexes/tables to reduce page splits. - Vacuum aggressively enough that HOT updates can succeed (
n_tup_hot_updvsn_tup_upd).
Step 6: Reduce connection stampedes
Hundreds of app connections amplify LWLock contention even when each query is simple. Put PgBouncer in front (transaction pooling when safe) and cap app pool sizes. If you are already near max_connections, see PostgreSQL too many connections.
Step 7: Apply carefully and re-measure
Change one setting or query pattern at a time. Re-run the wait_event grouping query during the same workload. Killing random backends clears symptoms for seconds but does not fix WALInsert or BufferContent root causes.
Code and Commands Examples
One view of waits plus blocking (heavyweight) for context:
SELECT a.pid,
       a.wait_event_type,
       a.wait_event,
       a.state,
       pg_blocking_pids(a.pid) AS blockers,
       left(a.query, 80) AS query
FROM pg_stat_activity a
WHERE a.datname = current_database()
  AND a.pid <> pg_backend_pid()
  AND (a.wait_event_type IS NOT NULL OR a.state <> 'idle')
ORDER BY a.wait_event_type NULLS LAST, a.query_start;
Laravel example that worsens WALInsert: saving models in a loop. Prefer bulk upserts:
// avoid
foreach ($rows as $row) {
    Model::create($row); // one transaction/commit pattern per insert
}

// better
Model::upsert($rows, ['unique_key'], ['col_a', 'col_b']);
Verification
SELECT wait_event, count(*)
FROM pg_stat_activity
WHERE wait_event_type = 'LWLock'
GROUP BY 1
ORDER BY 2 DESC;

SELECT name, setting FROM pg_settings
WHERE name IN ('wal_buffers','synchronous_commit','shared_buffers','max_connections');- During peak load, LWLock waiter counts stay near zero or drop sharply after the change.
- p95/p99 for write queries returns toward baseline in your APM.
- WALInsert no longer dominates after batching writes or raising
wal_bufferson a host that needed it. - BufferContent falls after fixing hot-row updates and indexes.
Prevention
- Batch writes; avoid per-row commits in application loops.
- Size connection pools for the database, not for "as many as the app server allows."
- Monitor
wait_eventaggregates (orpg_stat_database/ exporter metrics), not only CPU and disk. - Keep autovacuum healthy on high-update tables so HOT updates and buffer contention stay manageable.
- Separate WAL/data disks on write-heavy servers.
- Load-test imports and month-end jobs before they hit production.
FAQs
What is a postgresql lwlock?
A lightweight lock is an internal latch protecting shared memory (WAL buffers, buffer pages, lock tables). Waiting on one shows up as wait_event_type = 'LWLock' in pg_stat_activity.
Is LWLock:WALInsert always a configuration problem?
No. Often the app commits too frequently. Tuning wal_buffers helps only after you reduce unnecessary commits and confirm WAL I/O is healthy.
What does BufferContent wait mean?
Sessions are contending for the same shared buffer page contents, usually from hot rows or wide updates. Fix the access pattern and indexes before raising shared_buffers blindly.
How is LWLock different from Lock / relation locks?
Lock wait events are heavyweight locks (row/table). LWLock is for shared-memory structures. Both can appear in one incident, but the fixes differ.
Should I set lock_timeout for LWLock waits?
lock_timeout applies to heavyweight locks, not LWLocks. For LWLock contention, fix the workload and WAL/buffer paths instead.
Does increasing max_connections reduce LWLock waits?
Usually the opposite: more backends increase contention. Prefer pooling and fewer active sessions.
Comments
Join the discussion. Replies load on demand, up to 5 levels.
0 threads
No comments yet
Be the first to start the conversation.